

At first glance, 97.9% on-time payment sounds like a problem largely solved. For Merseyflow, which manages charges for the Mersey Gateway and Silver Jubilee bridges, that figure sat alongside approximately 140,000 penalty charge notices in April–June 2026.
The numbers are compatible. Across millions of crossings, even a small percentage means substantial enforcement activity.
Drive Zone's analysis of official operating reports finds a similar tension elsewhere: encouraging progress, substantial remaining penalty volumes, and figures that need careful interpretation. Four case studies show why the most useful question is what happens between making a journey and resolving the obligation it creates.
Merseyflow: small percentages, large numbers
Merseyflow reported approximately 6.82 million crossings in April–June 2026. Its published ratio of penalty charge notices (PCNs) to crossings was 2.05%, or about 20.5 notices per 1,000 crossings, alongside 97.9% on-time payment. Merseyflow's quarterly dashboard puts those percentages in context: approximately 140,000 notices over three months.
The longer comparison is encouraging. Crossings were 4.4% higher than in April–June 2024, while the rounded notice count fell from approximately 152,000 to 140,000, a reduction of about 7.9%. Traffic grew while enforcement volumes declined.
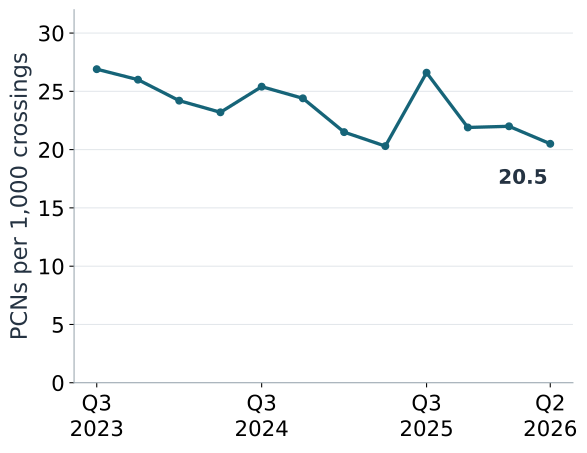
Chart: Drive Zone analysis of official publications
These figures describe activity within each reporting period. They do not follow individual crossings through to their eventual outcome, so the ratio should not be read as a driver's probability of receiving a notice.
Merseyflow: small percentages, large numbers — sources
ULEZ: cleaner vehicles and fewer notices measure different things
London's Ultra Low Emission Zone also recorded fewer penalties. TfL's monthly totals show 393,454 PCNs issued in April–June 2026, compared with 461,335 a year earlier: a 14.7% reduction. Even after that fall, the latest quarter averaged roughly 4,324 notices a day.
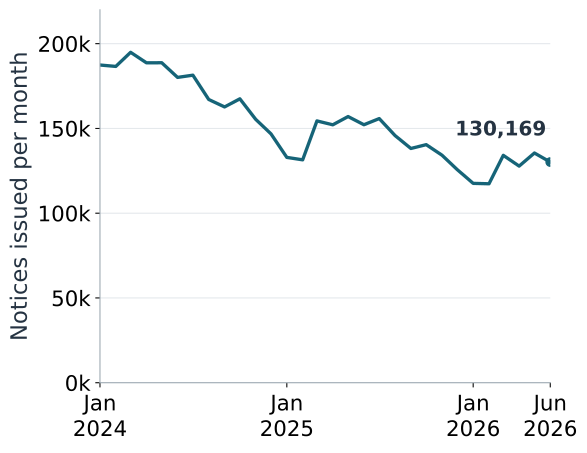
Chart: Drive Zone analysis of official publications
TfL reported 97.7% emissions compliance in each month of the 2026 quarter. That measures whether detected vehicles meet the emissions standard. Payment compliance answers a separate question: whether a charge was paid when required.
A vehicle failing the emissions standard does not automatically represent an unpaid charge, either. TfL's figures include exemptions, grace periods and other non-chargeable cases. The factsheet definitions, pages 2–3, matter as much as the headline percentage.
The evidence shows fewer notices. It does not tell us how many remaining cases arose from missed deadlines, misunderstood rules or other causes.
ULEZ: cleaner vehicles and fewer notices measure different things — sources
Dundee: a notice is one stage in a longer process
Dundee's Low Emission Zone issued 2,260 PCNs in January–March 2026, compared with 3,223 in the same months of 2025: a 29.9% fall. Comparing the same calendar quarter avoids a misleading seasonal comparison. Without corresponding vehicle-entry counts, however, this establishes a reduction in notices rather than a reduction in the violation rate.
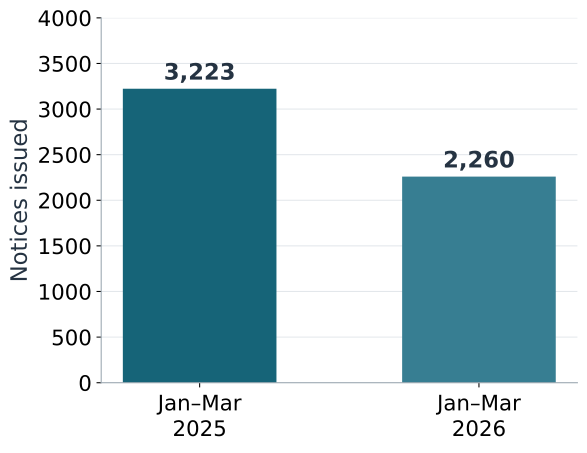
Chart: Drive Zone analysis of official publications
The newer report also reveals what can happen after a notice is issued. During April 2025–March 2026, Dundee recorded 1,509 appeals, of which 887 succeeded—about 59%. Reported cancellation grounds included exemption evidence, emissions compliance, vehicle sale and registration errors.
That is the success rate among appellants, not all notice recipients, and the report does not link every appeal to notices issued in the same period. It nevertheless illustrates why an issued notice and a final enforcement outcome are different measures.
Dundee: a notice is one stage in a longer process — sources
Dartford: rising income can accompany better payment compliance
Dartford offers the clearest warning against interpreting revenue alone.
Its 2024/25 accounts report payment compliance improving from 93.2% to 94.5%, while chargeable crossings fell from 50.2 million to 49.4 million. Yet recognised enforcement income rose from £91.0 million to £128.4 million, approximately 41%.
The accounts explain the apparent contradiction. A backlog associated with the July 2023 change in operating arrangements was cleared, increasing the number of notices issued and processed.
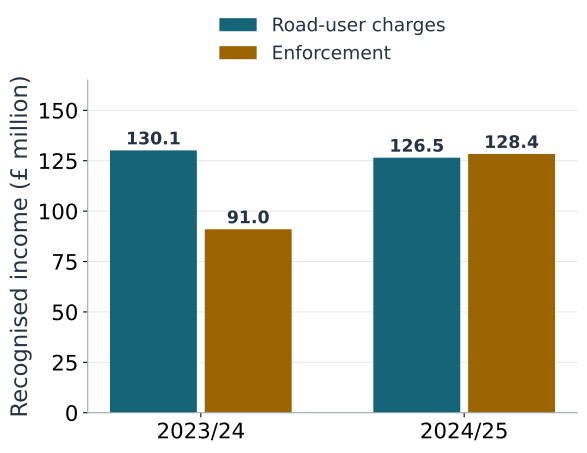
Chart: Drive Zone analysis of official publications
The income figures also include amounts recognised in the accounts before collection and before adjustments for sums that may not be recovered. They are not a cash-receipts total. A revenue-only headline would miss both the backlog and the improvement in payment compliance.
Dartford: rising income can accompany better payment compliance — sources
What would a more complete picture look like?
These reports show progress, but they leave an important question unanswered: how much remaining enforcement could clearer information or a simpler payment process prevent?
The national Clean Air Zone service report, page 38, offers a clue about where drivers need help. Leading contact themes included changes to charge results and uncertainty about whether a vehicle was chargeable. Those enquiries cannot explain every penalty, but they identify real points of uncertainty.
A fuller operational picture would follow chargeable journeys through timely payment, notices, cancellations, appeals and collection. It would help operators identify where the process breaks down and assess whether changes improve it.
For drivers and fleets, the practical steps remain specific: check the vehicle and journey, understand the scheme's rules, confirm any exemption or automatic-payment registration, and retain payment evidence.
For Drive Zone, the research sharpens the question our service should help drivers answer: what does this particular journey require me to do? The data supports measuring how well that question is answered. It does not establish how many penalties any app can prevent.
Analysis prepared on 12 October 2026 from official publications. These are selected case studies with different reporting periods and definitions, not a national total. PCNs count notices, not unique drivers or final upheld penalties. Comparisons use matching quarters where stated; Merseyflow notice counts are rounded by the publisher.